California satellite mosaic
Satellite view of Central Valley
A forest tile's embedding
Forest tile
vs
Comparison tile
Similar Different
Organizing
the World
How computers see the Earth.
Scroll to explore ↓
The raw material

Satellite Imagery

Satellite imagery is captured in chips — small 256 × 256 pixel squares that blanket the Earth's surface.
Zoom in

Isolating the Chip

Each chip captures a single moment of a single place — a patch of Central Valley farmland, frozen in pixels.
Compression

From Image to Point

A neural network looks at each chip and compresses what it sees into a single point — one dot that encodes what the landscape looks like.
Scale

94,346 Tiles

Do this for every patch of California and a familiar shape emerges — 94,346 dots, each one a real piece of the Earth.
Starting point

Geography First

Here every chip sits at its real-world latitude and longitude — a recognizable map of California.

The coastline, the Central Valley, the Sierra Nevada — all present and accounted for.
Key concept

What Is an Embedding?

A geospatial foundation model compresses each chip into a short list of numbers — an embedding.

Think of it as a visual fingerprint: the model distills texture, color, and pattern into a form it can compare.
Comparing fingerprints

Different Landscapes, Different Numbers

Forest vs. city: the bars pull apart. Red marks disagreement — the model sees these as fundamentally different places.
Similarity

Same Landscape, Same Numbers

Forest vs. forest: the bars align. Green marks agreement — similar landscapes produce nearly identical fingerprints.
Embedding Space

Organizing by Similarity

Now watch: every tile lifts off the map and flies to its position in embedding space.

Geography dissolves. What replaces it is a landscape organized by visual similarity.
Validation

The Model Agrees with Humans

Color each dot by its most common land-cover class from Google's Dynamic World dataset, and the structure becomes clear.

The model organized tiles into meaningful clusters — without ever being told what "water" or "forest" means.
Water
Trees
Grass
Flooded Veg
Crops
Shrub/Scrub
Built
Bare
Snow/Ice
Cluster dive

Water in Every Form

Zoom into the water cluster and the variety is striking: Pacific surf, Bay mud, alpine lakes, Sacramento Delta marshland — all grouped together by the model, all unmistakably water.
Cluster dive

California's Breadbasket

The model picks out farmland by texture alone — irrigated fields, orchards, and vineyards share a geometric patchwork that sets them apart from the natural landscape.
A different scale

Los Angeles Up Close

The same logic holds at city scale. Here are LA County's satellite tiles at their real-world coordinates, colored by land cover.
Rearranged

The Machine's Map of LA

Rearranged by embeddings, LA breaks into districts of pattern — freeways, rooftops, scrub, and water sorting themselves without instruction.
Pattern match

Golf Courses of LA

Look for rare patterns and they pop out: golf courses cluster together. Fairways, bunkers, and water hazards form a visual signature the model groups on its own.

Nobody told it what golf is.
The full picture

California, Through Embeddings

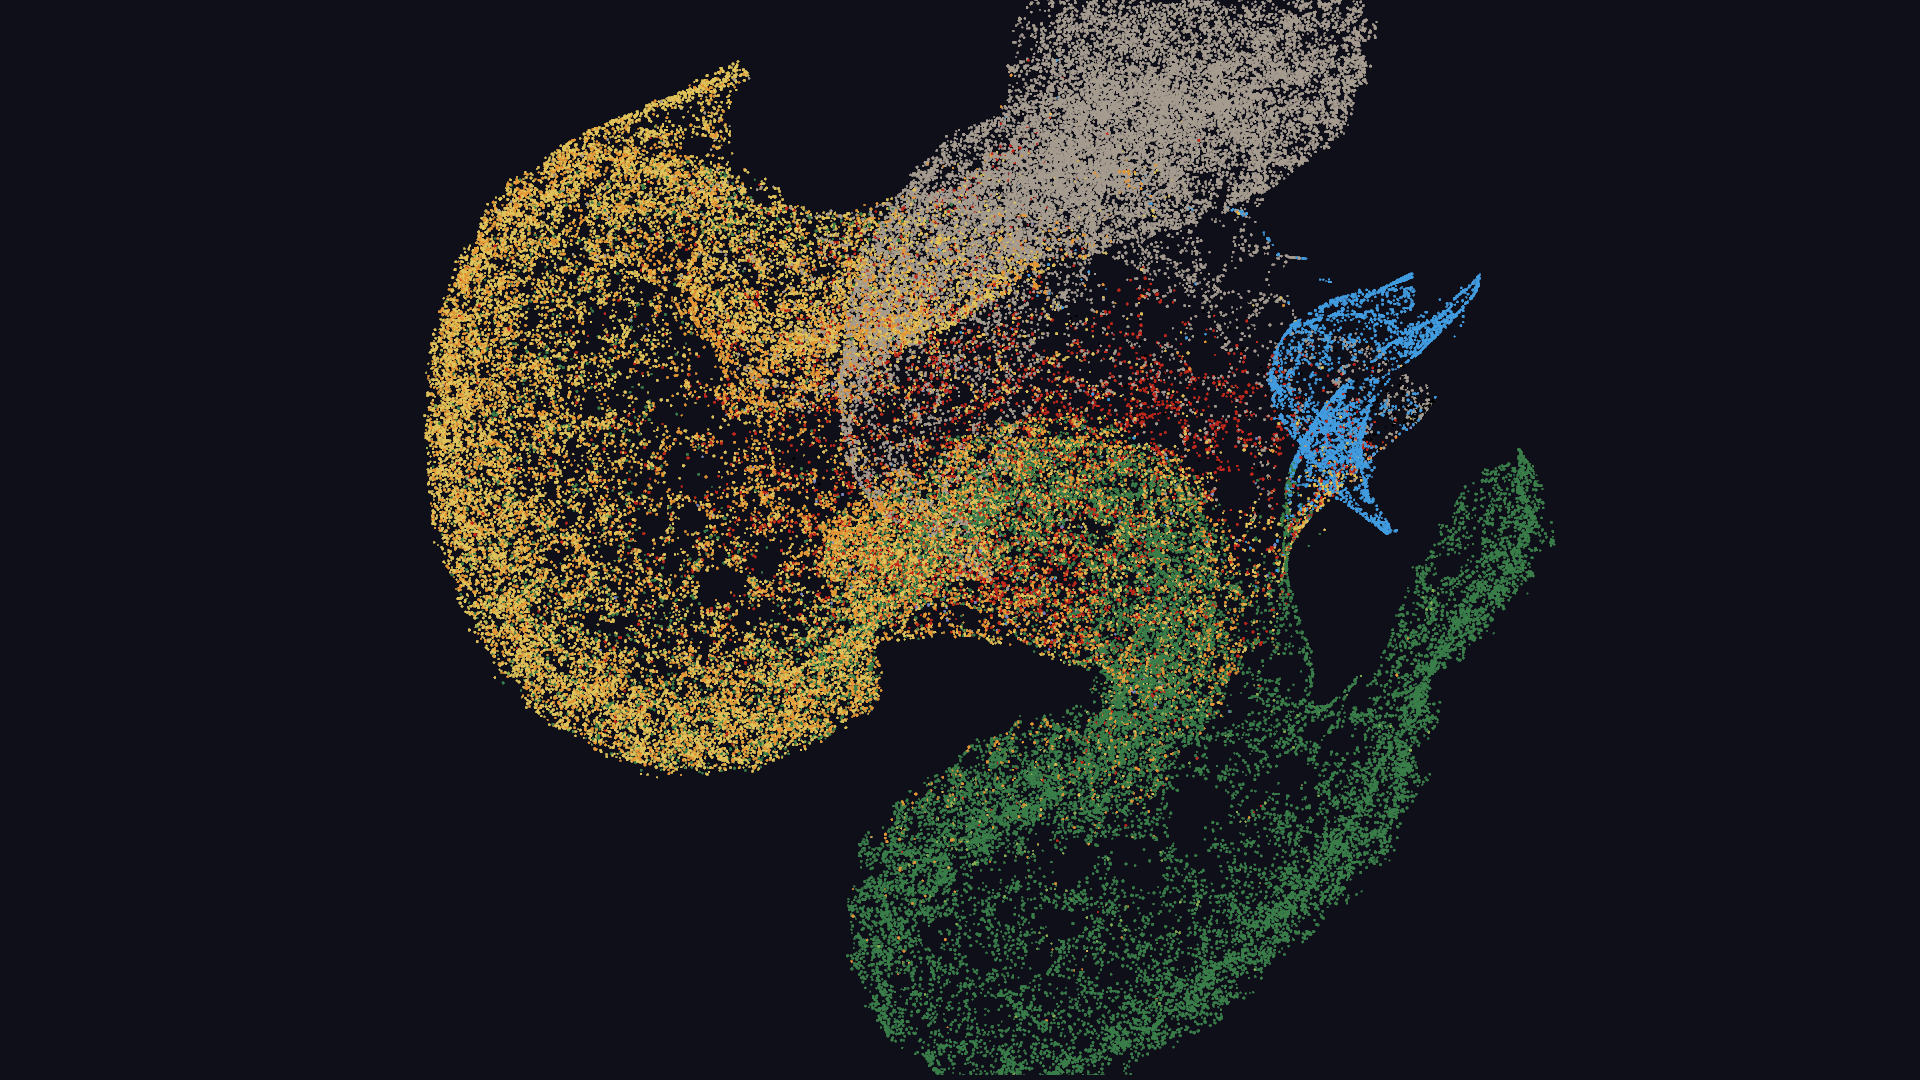
94,346 tiles, sorted by appearance alone. The clusters line up with how we name the land — water, forest, city — without ever being told the difference. That's the power of embeddings: structure emerges from raw data.

Built by Mason Grimshaw at Ode